Nevertheless there are ESM systems which do provide an acceptable picture and when viewed by experienced Operators provide an invaluable part of the mission systems of military platforms.
Analysis Tasks
So the first thing to do is establish the aims of ESM system performance evaluation, which are:
- To decide if the ESM has an acceptable probability of intercept
- To quantify the DOA accuracy
- To quantify the location accuracy for radar sites and platforms
- To test the identification process
Probability of Intercept (POI)
We need to decide if it is reasonable that the ESM should be able to receive signals from a radar at various ranges (power versus range calculations) and we need to test that the power received by the ESM is as expected given what we know about the power transmitted by the radar and the radar frequency.
For example, a typical 3 GHz air traffic control radar with an ERP of 83 dBW could be seen by an ESM system with a sensitivity of -65 dBmi or -40 dBW/m2 at a range of over 6,000 km, if we didn't have to take into account the radar horizon!
The Probability of Intercept does not only depend on the range and power of the transmitting radar, it also depends on whether the ESM is looking at all RF bands simultaneously or whether it has to switch between the various bands. The generation of an effective RF scan strategy is a service which can be offered by EW Defence by tailoring our Scan Strategy Development tool to the features of the ESM system.
It is easy to calculate the maximum range at which the ESM receives the radar signal at the peak of the radar scan. In practice the ESM needs more than one pulse to determine the characteristics of the radar signal it is receiving (usually at least 6 pulses are needed) so that means that the maximum range at which the ESM usefully receives the radar signal is reduced. The calculation of this reduced range depends on producing a model of the radar beam-shape. This can be achieved using the Beam Shape Calculator which takes as inputs the radar 3dB beam-width and the first sidelobe level, the maximum Pulse Repetition Interval , minimum Scan Period and radar ERP.
In order to decide whether the POI is acceptable a number of known radar sites, preferably in various RF bands should be chosen and a set of trial data should be gathered. The route taken by the platform on which the ESM is mounted and the platform altitude should be selected so that the radars are within the radar horizon of the ESM.
DOA Accuracy
The measurement of DOA can be carried out using amplitude comparison, time difference of arrival or phase difference techniques.
It is always the case that there will be errors in DOA as every transmission by the radar will have been subject to multipath which will affect the amplitude and phase of the pulse. Most of the pulses will have small DOA errors due to multipath reflections (< 1 degree), but a significant percentage of pulses have large DOA errors due to this cause.
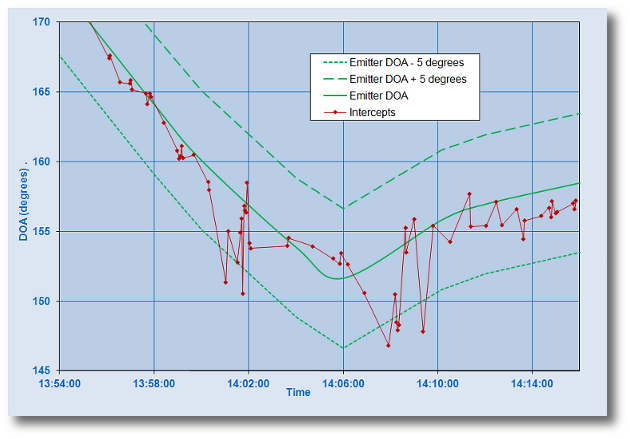
In order to decide if the DOA performance of the ESM is reasonable, a set of known radar sites is chosen and the correct DOA must be calculated for those sites (DOA and Range Profile Calculator). A graph of the correct DOA profiles is plotted against the DOAs of either the pulse data or the tracks which have been formed, so that the DOA accuracy can be visualised. In the following plot the correct DOA of a radar is shown, together with intercepts which have been received from the radar.
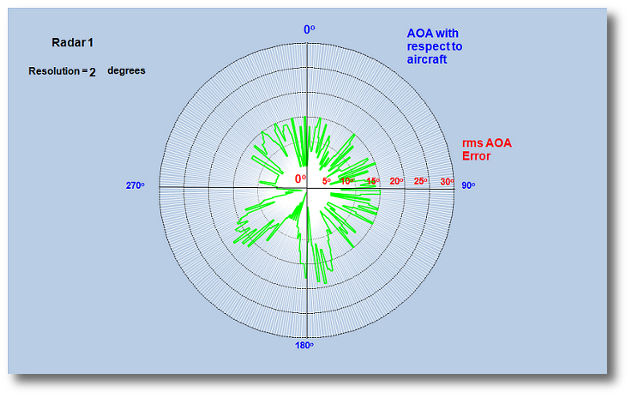
In order to check that the DOA accuracy is consistent for all Angles of Arrival at the platform, a circular plot can be produced.
Location Accuracy
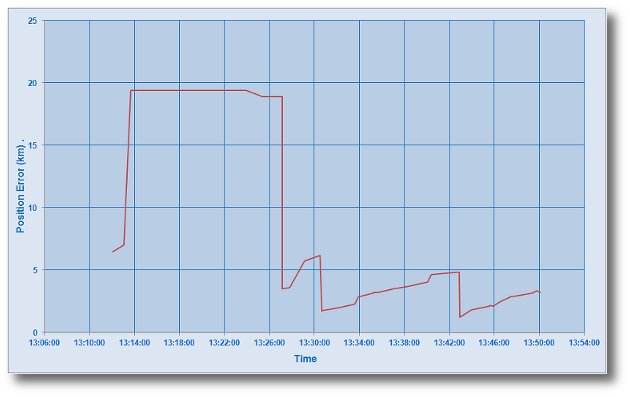
Many ESM Systems attempt to produce fixes for radar sites and moving platforms. Finding out the accuracy with which they achieve this is the next step in the evaluation of the performance of the ESM system. To quantify the location accuracy and to see how the accuracy improves (or not!) over time, the locations of a set of known radar sites are compared with the position fixes produced by the ESM.
Here is an example of a location accuracy plot
Identification
The identification of radars is one of the most difficult tasks of the ESM system. Identification is carried out by matching measured parameters (such as Radar Frequency (RF) and Pulse Width(PW)) and calculated parameters (such as Pulse Repetition Interval (PRI)) of intercepts with those held in a library within the ESM system.
The difficulty that the ESM system has is that there
is a huge amount of overlap in parameters between radars. For example, there
are several hundred types of radars with RF between 9.3
and 9.45 GHz, the radar band in which ships' radars operate.
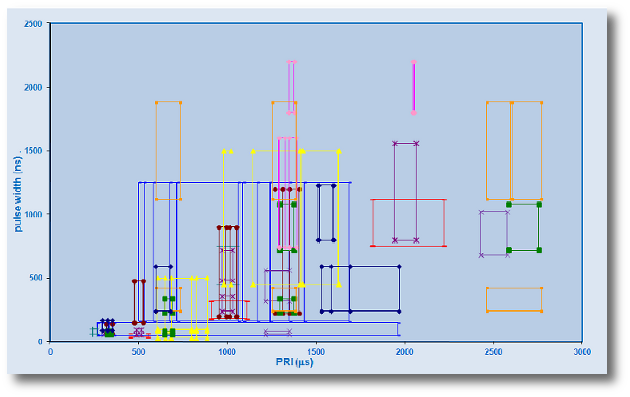
Plotting the
Pulse Width and PRI ranges of just a dozen of these radar types shows the
impossibility of uniquely identifying any one of them.
Usually the authors of ESM libraries make the mistake of trying to cater for every possible mode of the radars which they believe will be detected in the environment in which the ESM is due to operate. It is actually better to look at the way in which a specific ESM generates PRIs and to make use of these parameters in the ESM library.
A software tool for generating ESM libraries has been developed by EW Defence. (Library Generation) This tool can also be used to test the identification performance of the ESM system.